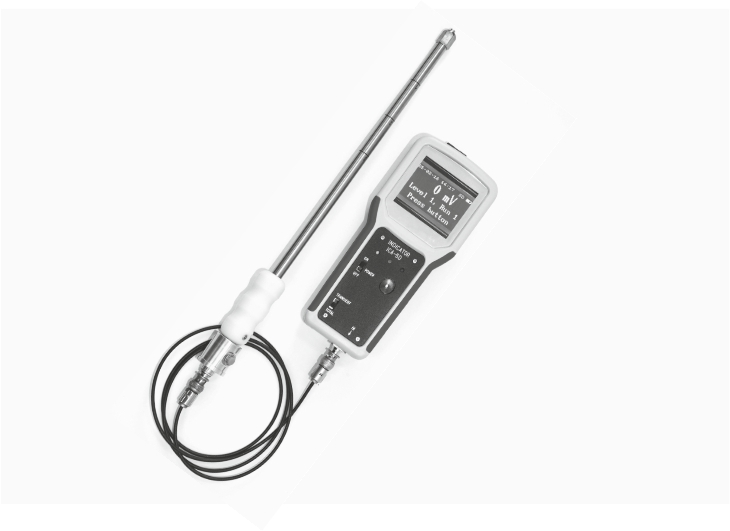
HIGH-FREQUENCY CAVITOMETER WITH USB CONNECTION TO A COMPUTER AND DATA PROCESSING SOFTWARE
Designation
Measurement and control of cavitation activity in liquids and biological structures, in particular, for optimizing ultrasonic technological processes, determining the presence and activity of cavitation.
The cavitometer is equipped with a USB output and a memory card, comes with a data processing software.
Application areas
Chemistry, sonochemistry, biology, medicine.
Measurement modes
-
full cavitation activity
-
digital output of measurements to the computer
-
recording of output signals in form of time dependences
Technical characteristics
|
Temperature of working liquid, °Ñ
|
4...120 |
|
Frequency band of the ultrasonic field to generate cavitation, MHz
|
0,2…3 |
| Supply voltage | rechargeable battery |
| The input of measurement modes to the peripheral device is provided. |
Delivery package
Electronic unit - 1pc
Remote sensor - 1 pc
Software CD
Operating principle
The operating principle of the device is based on the analysis and processing of the spectrum of the cavitation noise received by a broadband hydrophone.
During pulsations and collapse, cavitation bubbles generate acoustic disturbance and shock waves, which is caused by a strong intensifying effect of ultrasound on the physicochemical processes in liquids and molten metal. The more intensive the shock wave, the more high-frequency components are in a Fourier series representing this wave. Therefore, concentration of bubbles and their collapse intensity increases with the intensity of high-frequency components in the spectrum of the cavitation noise that is expanded in the high-frequency region.
Measurement of cavitation activity allows one:
To determine the effectiveness of various baths;
To establish the distribution of ultrasonic field in the bath;
To set distribution of cavitation activity in the working capacity;
To establish the influence of the physical field parameters and fluid properties on the cavitation activity;
To optimize sound conditions and to choose the optimal mode of hydrodynamic systems.
Description of the data processing program
The program allows you to record the time change in the activity of cavitation and simultaneously display this change in form of a graph on the computer monitor in real time. The measurement results in form of tables and graphs are saved as separate files automatically based on the saving algorithm selected by the operator.
Range switch during data recording can be performed automatically. Duration of the experiment, i.e., duration of the registration is selected by the operator.
Apart from plotting, the program performs statistical processing of data, namely, calculates the average value of the recording time, the maximum and minimum values thereof, the dispersion values for a single measurement cycle. Such cycles can be numerous (as many as the operator chooses). There are also computed: average of three measurements graph, maximum, and minimum measured values, standard deviation at each point, and others.
Having time dependencies of the three specified parameters, the dependences of cavitation activity on temperature or on the emitter voltage can be constructed. The option to build such charts can be added to the program.
Terms and conditions of delivery
Delivery terms – under the delivery agreement.
Prepayment – 100% or with an advance payment of 40%.
Delivery time – within 40 working days after prepayment.


